Overview
The main goal of Report Builder version 2.3.0 is the upgrade to the charting library (used for the chart widgets) to the latest available version. This is largely a behind-the-scenes change, although you may notice some very subtle differences to the look and feel of the charts. Besides improving performance and adding functionality, this enabled a number of chart-related feature requests and bug fixes. Version 2.3.0 also includes several non-chart related improvements and bug fixes, as well as changes to support new behaviour in the latest update to ArcGIS Online.
New features
Ability to remove chart axis lines without removing axis labels
We have introduced two advanced settings to cartesian charts called X Axis – Show Border? and Y Axis – Show Border? which allows for a chart like this (no Y-axis line):

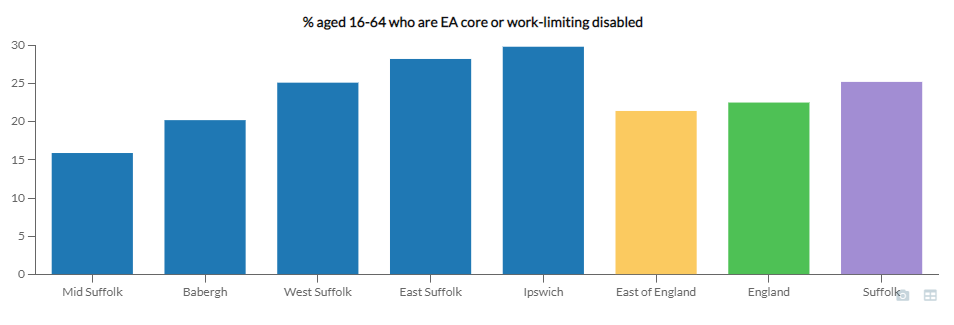
Ability to show comparison bars in bar charts on the far right
Values for comparison areas are now always displayed to the right of any bar for core layer feature(s) and are not included in the sorting of the other bars.
Ability to insert the value for the current date and the current date
You can now use the #TODAY variable in a Text or Text Box widget to display indicator values for the current year. This is useful for indicators where the latest date might be different from the current date e.g. population projections.
The #TODAY variable picks up todays’ date and returns it using the specified format:
#TODAY{yyyy} = '2022'
#TODAY{mm} = '03'
#TODAY{mmm} = 'Mar'
As this is the 1st variable to be processed you can use inside the #IVALUE variable using this syntax:
#IVALUE{<id>,1,#TODAY{yyyy}}
Here is an example:
#INAME{catalog:I25097}, #TODAY{yyyy} = #IVALUE{catalog:I25097, 1, #TODAY{yyyy}}
This would result in the following text:
2018-based projected population, persons aged 0-4, 2022 = 13,314
Further information can be found in the Variables help page.
Export icon tooltips added
A tooltip has been added to the export icons of charts and tables.
Ability to add line breaks to tooltips
You can use \n to add a line break into a chart tooltip. This is especially useful for smaller chart widgets where the tooltip would otherwise be cut off.
Disable widget double-click edit
By default, double-clicking on a widget in a report will open the Data & Settings dialog, or in the case of a Text or Text Box Widget, the text editor. While double-clicking on a Text or Text Box Widget, it is possible to accidentally click the Cut button in the widget toolbar and remove the widget from the report, particularly if the text widget only contains one line of text. If you are finding this a problem, you can disable the double-click action for widgets. You can do this by clicking the ellipsis in the top right corner of Report Builder and toggling the Double-click to Edit setting.
Changes in Pie Chart legend layout
The update to the latest charting library meant that we had to make minor changes to the layout and position of Pie Chart legends. If you are using Pie Charts in your reports, especially if these are smaller widgets, you should check that all legend categories are still visible. If not, please adjust the size of the widget slightly until the full legend is displayed.
Key bug fixes
Chart widgets
- Cartesian charts: axis colour is overwritten by grid line colour
- Bar charts: bars sit on top of X-axis, causing axis line to only be visible between the bars
- Pyramid Chart: palette colour is only applied to left side of chart
- Report Builder crashes if you set a pyramid chart to Constrain Palette Colours = True and have only one colour defined in the Palette
- Population pyramid with aggregated data – data label left/right settings get overridden
- Scatterplot widget: default point size is too small
Text / Text Box Widgets
- When highlighting the default text to delete it, the text editor closes if the mouse pointer is moved outside of text box
- Inserting an icon doesn’t allow the icon to be selected (to delete it or change size or colour) and doesn’t allow for text to be added after the icon
- Text not showing in Edit Text/Rules popup (the first time you edit it)
Other bug fixes
- Report Builder doesn’t support nested/grouped layers in web maps built with the new ArcGIS Online map viewer
- First page is blank if you print a report using Firefox
- Groups on Report Builder home page are not displayed in alphabetical order
- Time Series Table: table breaks if the indicators have different dates available
- Long delay for a table widget to show when added to a report
- “Save As” on existing report creates an AGOL item with an incorrect URL
- Page order dialog crashes when report contains a large number of web map widgets
We hope you will enjoy this new release of Report Builder!
If you have any questions relating to this release please contact support@instantatlas.com.