This tutorial describes how to create a new report from an ArcGIS Online web map.
Step 1 – Create a report and choose a web map
On the Report Builder home page, click the arrow to the right of the New Report button. Then click the from Web Map option.
The Choose web map window will open. This will list web maps according to the option selected at the top of the window. For this tutorial, click the All option and type ‘BRFSS United States – Demo Map’ into the search box.
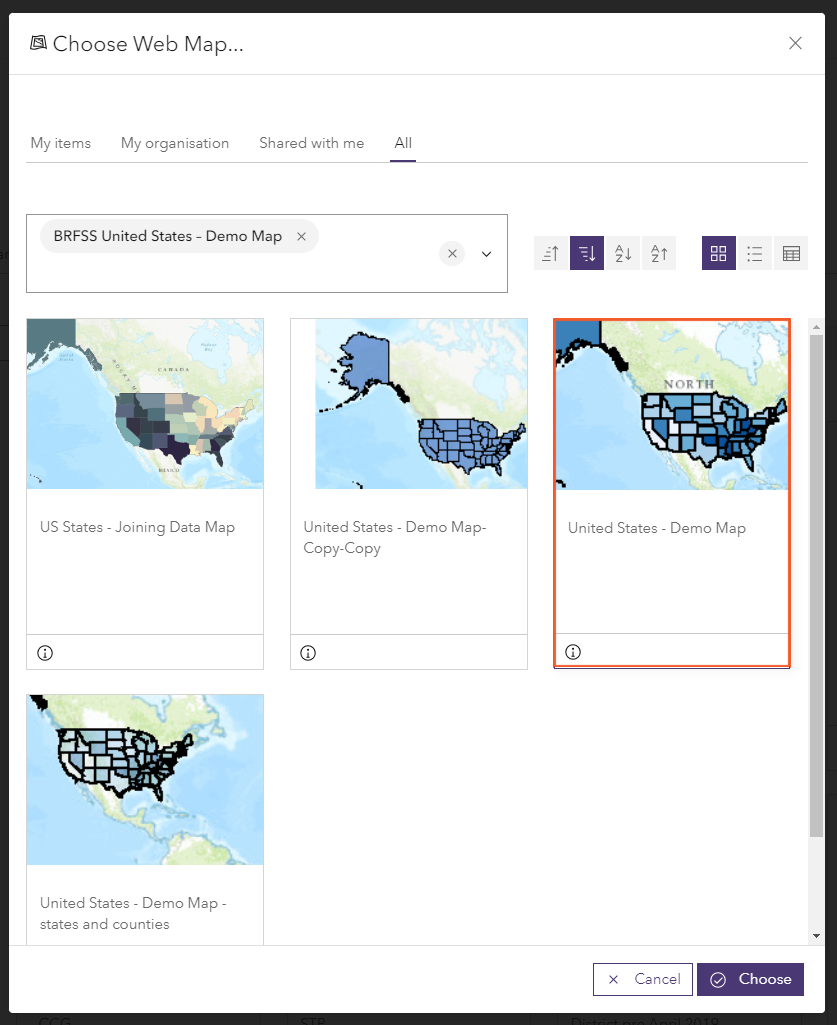
Click on the web map called ‘United States – Demo Map’ to select it (ignore the copies of this web map that other ArcGIS Online users have made!). Then click the Choose button.
Step 2 – Choose the layer and ID/name fields
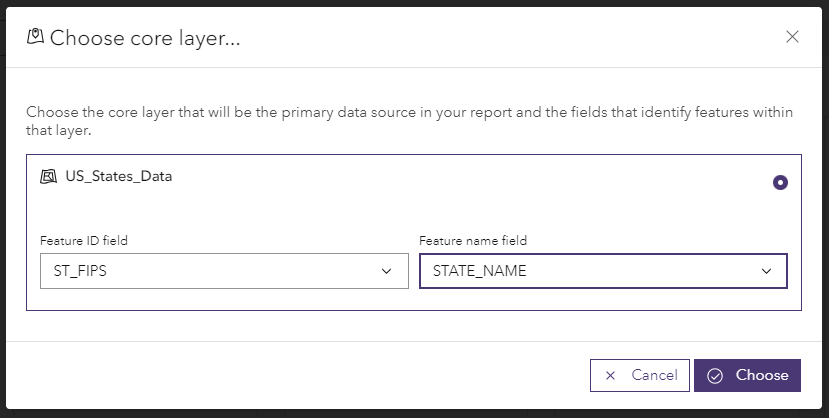
You will be prompted to choose the layer in the web map to use for the report. In this case there is only one layer. This layer is a map of the states in the USA with a number of different attributes about the structure of the population.
- Feature ID field – the attribute field in the base layer for the report that will provide the IDs for the features in the layer. The values in this field should be unique and should be short strings of alphanumeric characters that do not contain special characters (as the IDs are used to build URLs). If you add further data sources to the report, these will also need to contain a field with the same values so that the data can be joined to the correct features. It is therefore important that you think about and choose the correct ID field for your report before you start adding data to widgets.
- Feature name field – the attribute field in the base layer for the report that will provide the names for the features in the layer. These will be the feature names used in the report.
You should now tell Report Builder which fields in the layer contain the IDs and the names for the states. In the Feature ID field box choose the ‘ST_FIPS’ field and in the Feature name field box choose the ‘STATE_NAME’ field. Then click the Choose button.
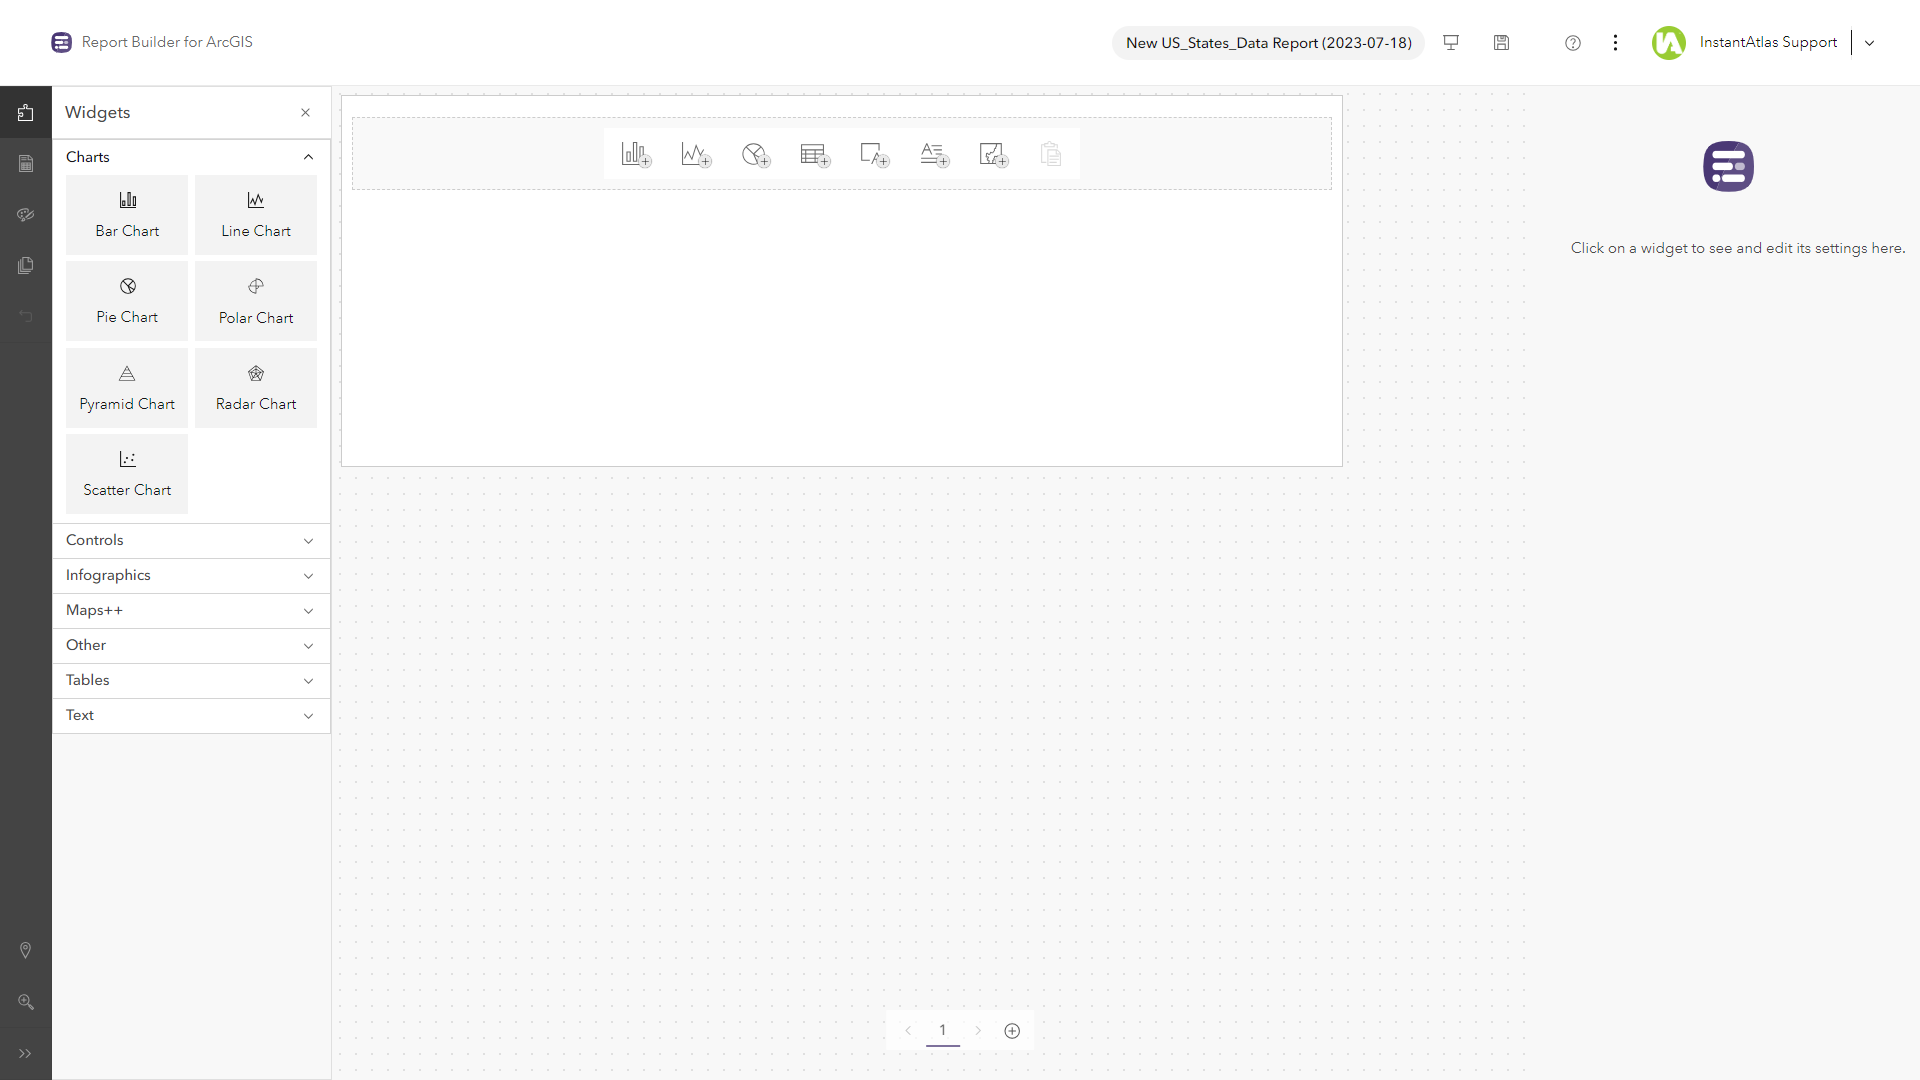
The report will be created in your ArcGIS Online organization and you will be presented with the Report Builder editor page.
Step 3 – Add a Text widget to your report
You are now ready to add a widget to the blank report, which is shown in the middle of the page. We will start by adding a title at the top of the report. In the Widgets menu to the left of the report, click the Text heading to expand this group of widgets. Click on the Text widget and drag it onto the report.
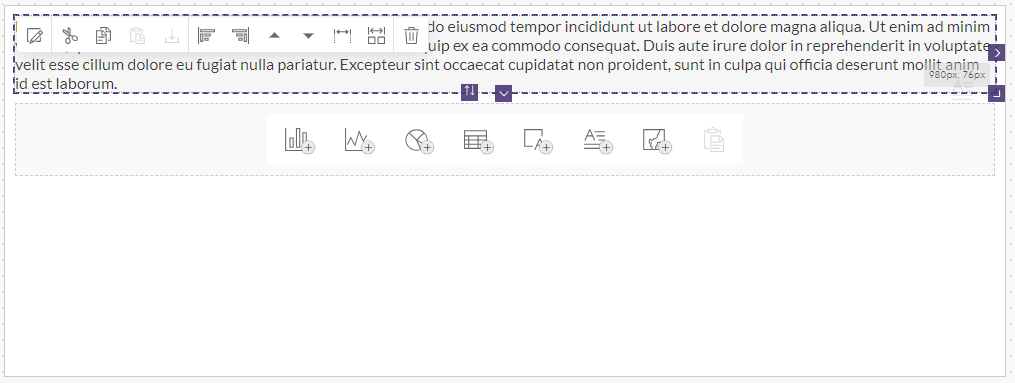
The text widget will appear at the top of the report and will be populated with example text. The widget is selected, meaning that it is highlighted with a dotted border and the widget toolbar is displayed in the top left corner. Click the Edit text & rules button in widget toolbar (first on the left). The text editor toolbar will appear. The example text should selected by default (blue) but if not, press Ctrl+A on your keyboard to select the text. Press the Delete key on your keyboard to delete the text.
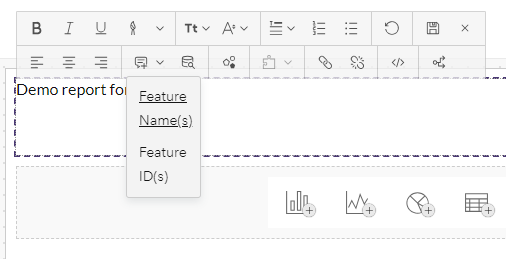
Now type ‘Demo report for ‘ and then click the Insert feature value button (second row, forth from the left) in the text editor toolbar that displays above the widget. Click the Feature Names(s) option. This will insert a substitution variable that will show the name of the active feature for the report.
Then click the Save changes button in the text editor toolbar (top row, second from the right). Your report should now look like this.
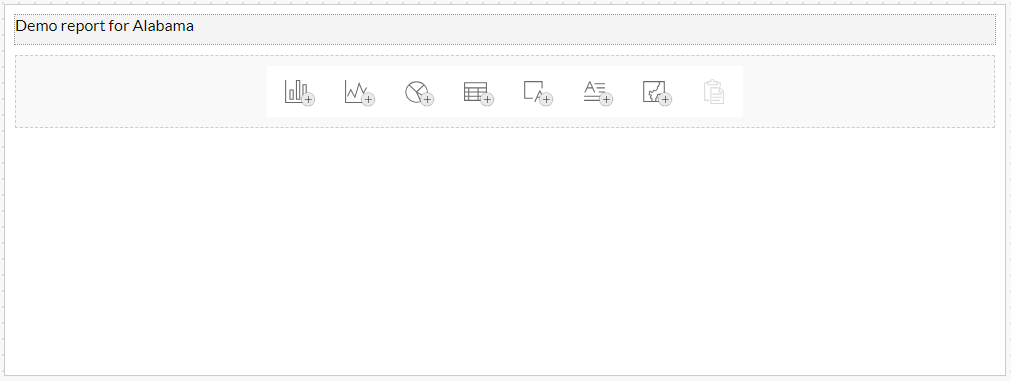
You can see that the name of the first state is displayed. If you wish, you can switch the active feature by clicking the View option. This can be found near the bottom of the Report Builder main menu on the far left. You will see that the feature name in the text widget will change. Click the view option to display the list of features in the base layer of the report, in this case the states in the USA. If you click to select a different state, you will see that the title of the report automatically updates.
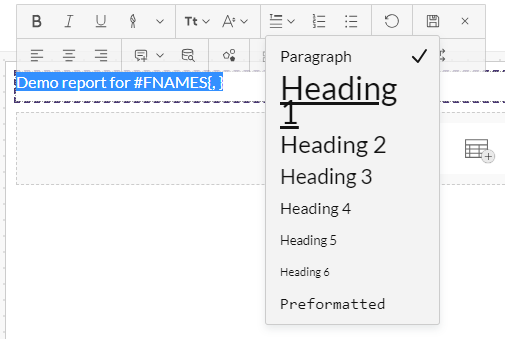
To make the text look more like a title, click on the text widget in the report to select it and click the Edit text & rules button once again. Select the text by pressing Ctrl+A on your keyboard. Click the Blocks button (top row, sixth from the right) in the text editor toolbar and click Heading 1. Then click the Save changes button in the toolbar.
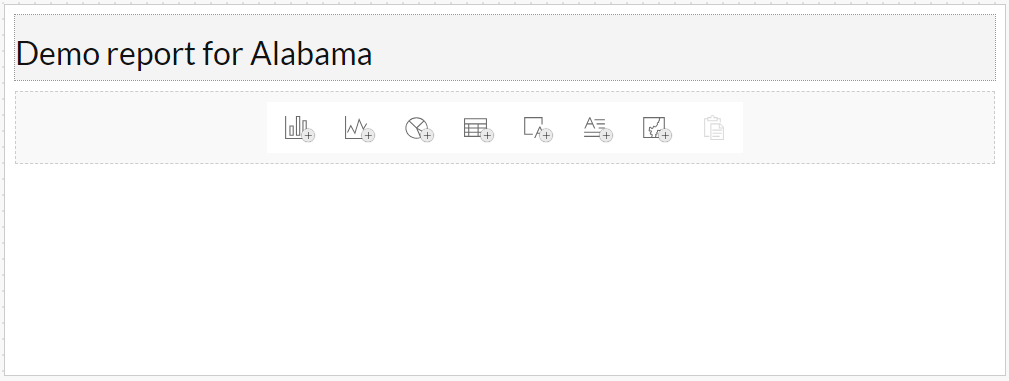
The text widget will automatically resize to show the text. Your report should now look like this.
Step 4 – Save your report
At this point it is a good idea to save your changes to the report. Click the Save button at the very top of the editor screen, to the right of the report name. This button displays a purple dot if the report has unsaved changes and this dot will disappear once you click the button. When building a report, it is good practice to click the Save button at frequent intervals to minimize the chance of losing your work if, for example, a network issue occurs.
Step 5 – Add a Data Table widget to your report
You can now add further widgets to your report to display data about the states. If the Widgets menu is no longer displayed, click Widgets in the Report Builder main menu on the far left. Click the Tables heading to expand this group of widgets. Drag a Data Table widget onto the page below the text widget. By default, the table will show the active feature in a row and a random selection of fields from the report’s base layer in the columns.
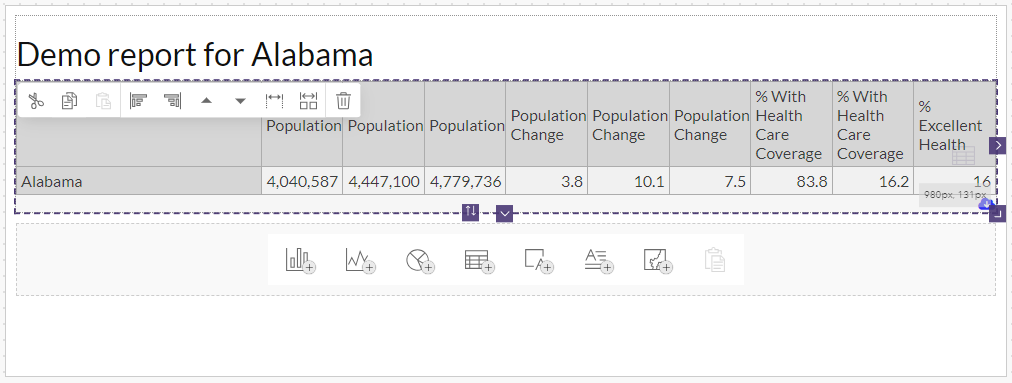
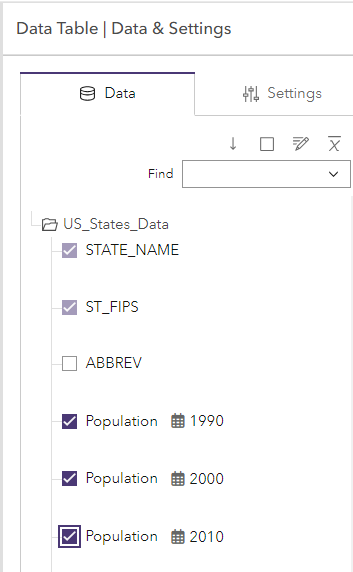
The Data & Settings panel to the right of the report displays the data and settings for the widget selected in the report, in this case the data table. Click the Data tab. This will display a single data source – the layer you selected when you created the report (US_States_Data). Click the data source to view the attribute fields. Click the Select no indicators button at the top of the Data tab (second button from the left) to deselect all fields. Then click the relevant checkboxes so that just the three dates for the ‘Population’ indicator are selected and click Apply.
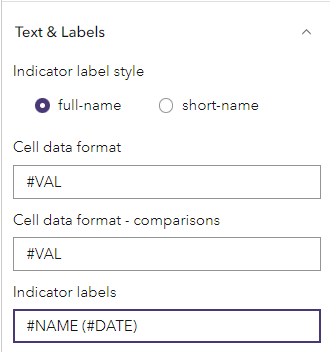
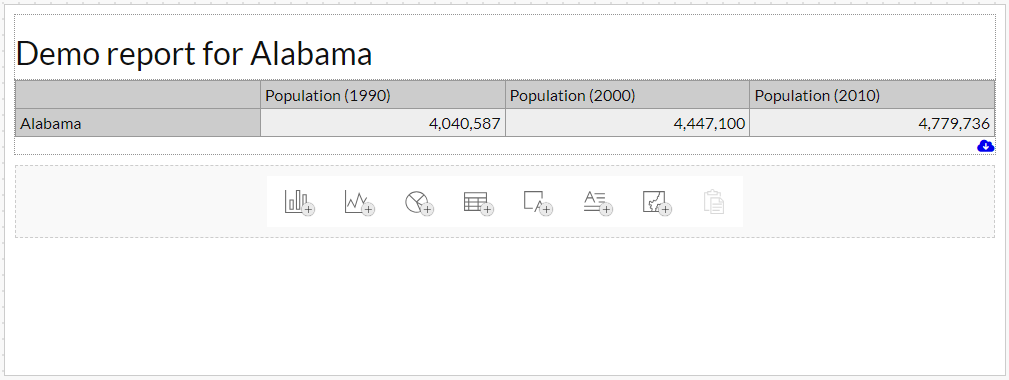
You will see the table update so that it now only shows three columns. In the Data & Settings panel, click the Settings tab. Click the Text & Labels heading to expand this group of settings. Locate the Indicator labels setting. Click in the box and type to change the value to ‘#NAME (#DATE)’. This will ensure that the table will display the date as well as the name of the indicator. Then click the Apply button at the bottom of the panel.
The data table should now look like this.
Step 6 – Add a Bar Chart widget to your report
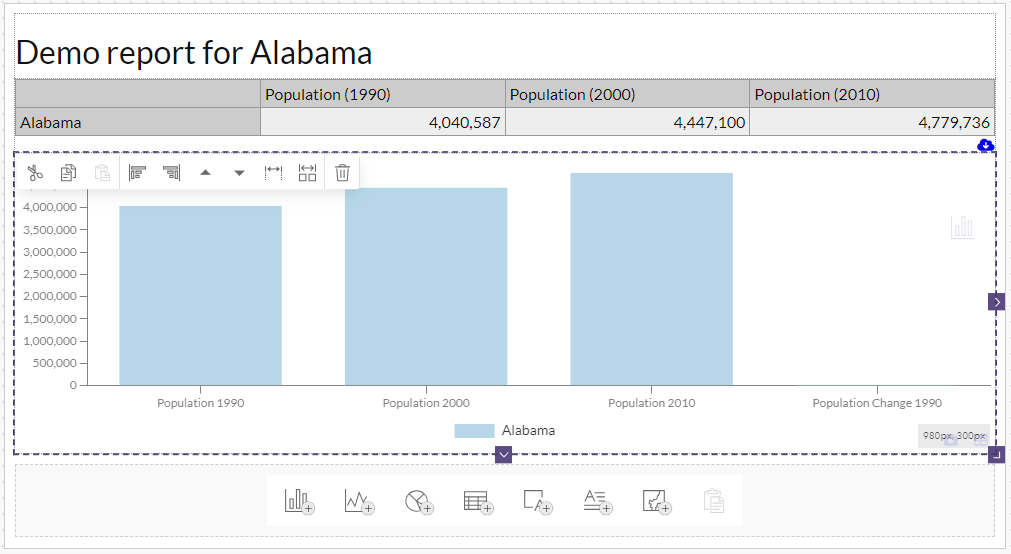
Drag a Bar Chart widget onto the page just below the data table widget.
In the Data & Settings panel, click the Data tab and edit the selection so that only one checkbox is selected for ‘% Poor Health 2010’.
Then click the Settings tab. If the Advanced button at the top of the tab (first button on the left) does not have a purple dot, click the button – this will ensure that advanced as well as basic settings are displayed in the panel.
Click the Behavior heading to expand this settings group, locate the Include all areas setting and turn this on.
Click the Series heading, locate the Type setting and tick the indicators-as-series checkbox.
Click the Bars heading, locate the Sort bars by value setting and tick the ascending checkbox.
Click the Axes heading, locate the Allow label word wrap setting and turn it off.
Click the Colors & Highlights heading, locate the Highlight selected feature setting and turn it on.
Click the Legend heading, locate the Show legend setting and turn this off.
Then click the Apply button.
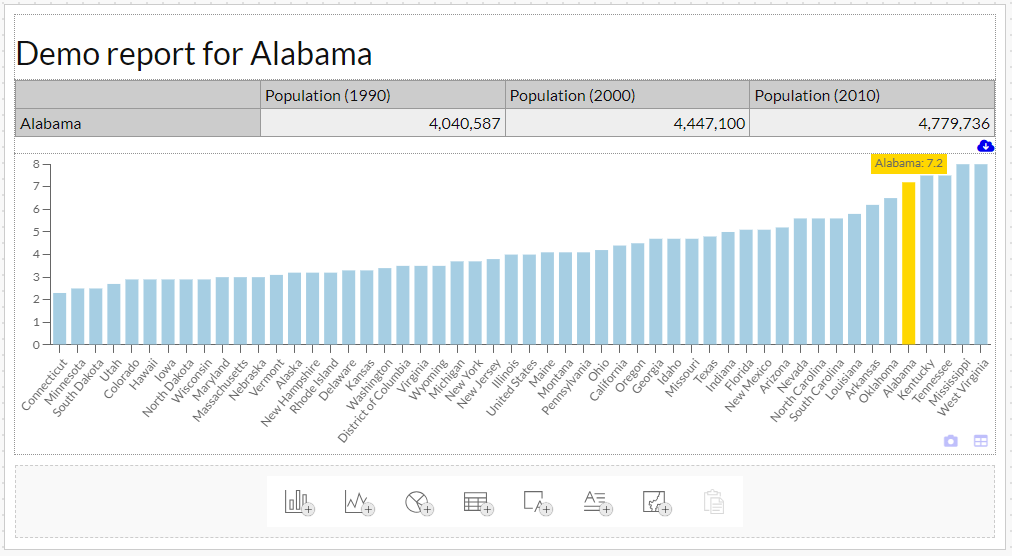
This is a good example of editing widget settings in combination to generate a completely different chart from the one you started with. Now save the report.
Step 7 – Preview your report
To preview your report, click the Preview button at the very top of the Report Builder editor screen, next to the report name. A new browser tab or window will open that displays the report as an end-user would view it.
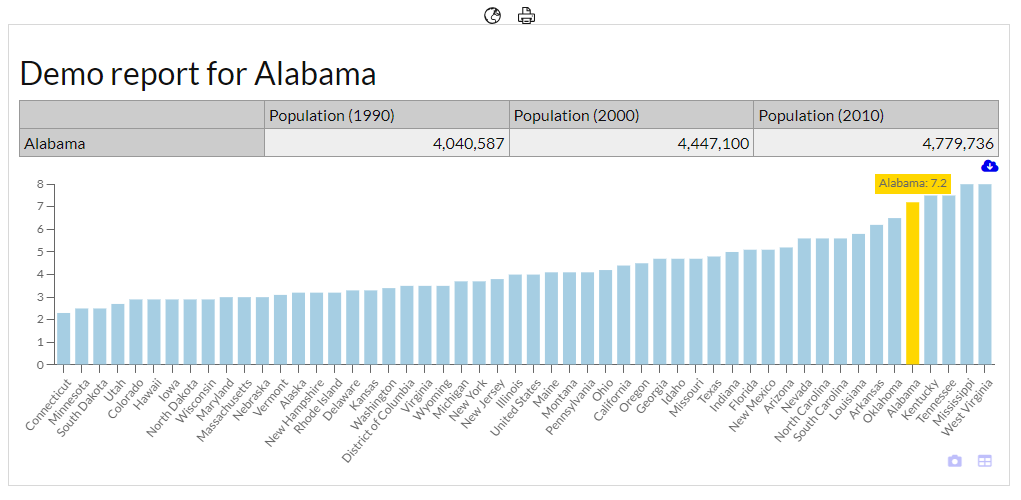
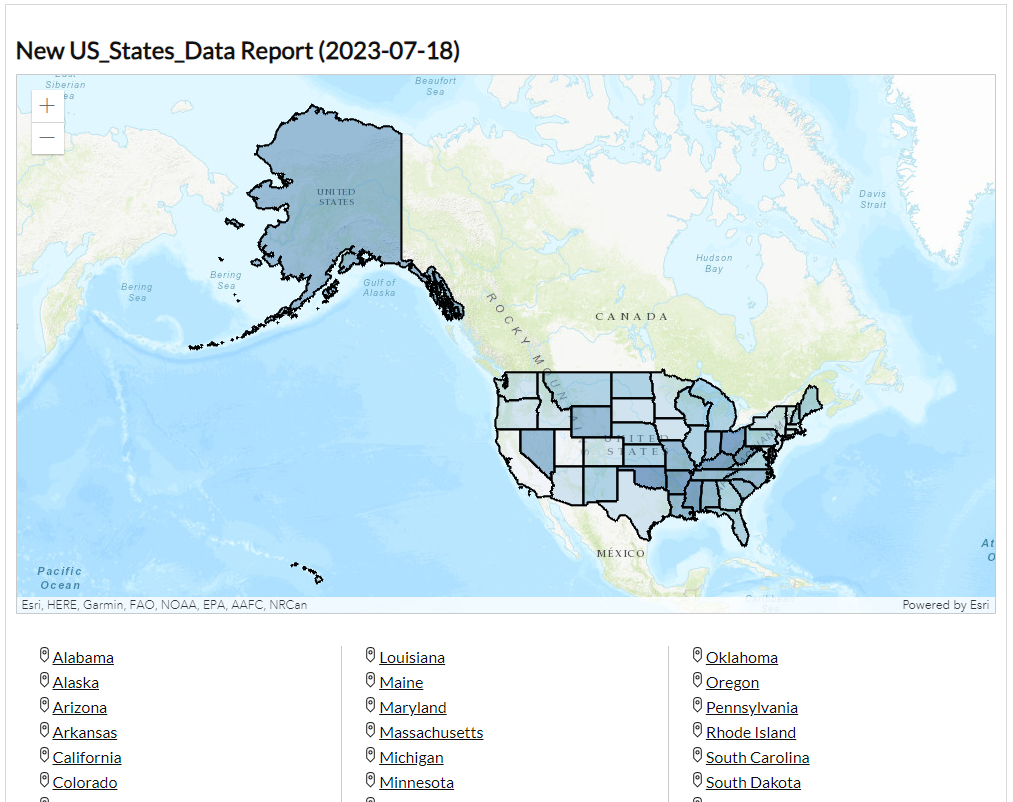
You can change feature by clicking the Index button (globe) in the toolbar at the top of the report and selecting a different feature from the report index page.
Step 8 – Share your report
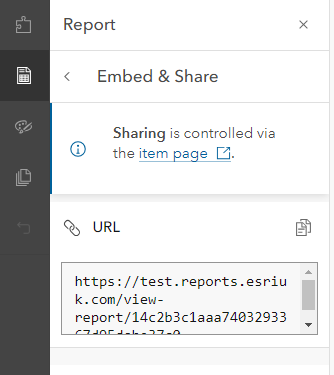
To share your report (if you wish to) you should return to the editor screen and click Report in the Report Builder main menu on the far left. In the Report menu, click Embed & share. By default a report can only be viewed and edited by the owner. To change this, click the link to the item page. In ArcGIS Online, you can use the Share button on the item details page to share the report with your organization, everyone, or set specific group sharing. Note that if you would like end-users to be able to view the report without having to sign in to ArcGIS Online, you will need to share the report with everyone.
Next steps
Try adding further widgets to the report and changing the data selections and settings. You can also change the report styling or pages options by clicking Styling or Pages in the Report Builder main menu. When you have finished, click Report in the main menu and click Exit editor to return to the home page.
You may want to create a new report using a different web map. If a web map with the geography or data that you wish to show in your report does not already exist, you will need to create this first using the standard tools available in ArcGIS.
![]() Tip: remember that the web map you choose should have a layer with a useful set of attribute fields, ideally with friendly names so that you know what data they contain. You can give these fields friendly labels in ArcGIS Online by setting aliases in the Configure Attributes dialog.
Tip: remember that the web map you choose should have a layer with a useful set of attribute fields, ideally with friendly names so that you know what data they contain. You can give these fields friendly labels in ArcGIS Online by setting aliases in the Configure Attributes dialog.