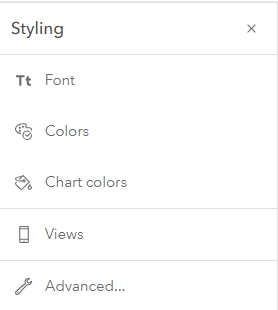
The Styling menu provides access to options to control the colors and fonts used in the report, in addition to some more advanced options.
Font
The Font menu provides access to a number of options.
- Family – choose the global font family for text in the report. You can find additional information on the Fonts page.
- Size – choose the global font size for text in the report
- Apply to charts – turn this on to make the settings above apply to the text in charts as well
Colors
The Colors menu is for making global color changes across all of the widgets contained in a report. You can set colors for separate elements such as Text, Headings, Borders, etc. Simply click a color to change it using your browser’s color picker. There are also buttons at the bottom of the menu that apply pre-defined color combinations.
Chart colors
The Chart Colors menu is for making global color changes across all of the chart widgets in a report.
- Chart palette – the chart palette that is applied for the base feature(s) in your report
- Comparisons palette – the chart palette that is applied for the comparison area(s) in your report
- Background color – the chart background color
- Axes & Text color – the chart axis line and text color
- Axes Grid color – the chart grid lines color
Views
The Views menu provides access to options that control how the report view behaves. More information is available on the Views page.
Advanced
The Edit CSS box is described on the Custom CSS page.