This page describes how to create a new report from an InstantAtlas Data Catalog. A data catalog is a specific way of simplifying the structuring, navigation and delivery of large volumes of statistics and indicators within ArcGIS Online. It is the way in which Esri UK delivers data for the National Data Service as a managed service.
If you are not licensed to access data in an InstantAtlas data catalog, you should create a report from a web map or a feature layer instead.
Step 1 – Create a report and choose a data catalog
On the Report Builder home page, click the arrow to the right of the New Report button. Then click the from Data Catalog option.
The Choose Web Map window will open. This will list web maps according to the option selected at the top of the window. For this tutorial, click the All option and type ‘BRFSS United States – Demo Map’ into the search box.
The Choose Data Catalog window will open. Click the relevant option at the top of the window. If you want to use a data catalog that you created, click My items. If you want to use a data catalog that you do not own but that is owned by another user in your organization, click My organization. If you want to use a data catalog managed by Esri UK on your behalf, click Shared with me. If the data catalog does not appear contact the Esri UK Technical Support helpdesk (UK and Ireland customers only). International customers please email internationalsupport@esriuk.com.
Then click on the data catalog you wish to use and click the Choose button.
Step 2 – Choose the layer
You will be prompted to choose the layer in the data catalog to use for the report. A catalog may contain just one layer but most will contain multiple layers. Click on the layer that you wish to use and click the Choose button. Note that the Feature ID field and Feature name field boxes should automatically be populated if the rules for creating a data catalog have been observed.
Step 3 – Add widgets to the report
The process for adding widgets to the report is the same as for reports created from a web map or a feature layer. Choosing settings for the widget is also essentially the same.
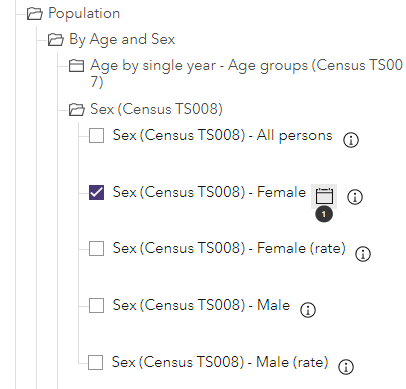
There are some differences when it comes to selecting the data for a widget. In the Data & Settings panel, under the Data tab, the first folder is the underlying feature layer that the report is based on – you can ignore this. The second folder contains the data in your data catalog. You can expand folders within the catalog to locate the indicator(s) you wish to add to the widget. There is also a search tool to make it easier to find them.
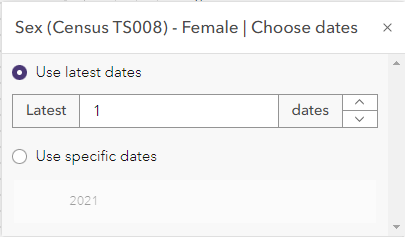
When you select the checkbox for an indicator, you can also decide what the dates setting should be. Click the Dates button immediately to the right of the indicator name.
You can type in a number to show the latest X dates. In this case, the widget will automatically remain up to date when new date instances are added to indicators in the data catalog. Alternatively, you can choose for the indicator to show specific dates. In this case, it will always show these dates, even if the indicator gains new date instances in the data catalog.