Overview
Report Builder version 2.5.0 includes enhancements such as an expanded and improved way of applying cell colour rules for table widgets, the ability to create bar charts with dates as series and a choice between light or dark themes for the interface. We have also used this release to fix a number of bugs.
When you sign in you will see that the name of the app has changed to Report Builder for ArcGIS. This is how we will be referring to the product in our documentation going forward. You will also notice some minor styling changes to the interface, as well as a shiny new logo – we thought it was time for a change!
New features
Improved and expanded table cell colour rules
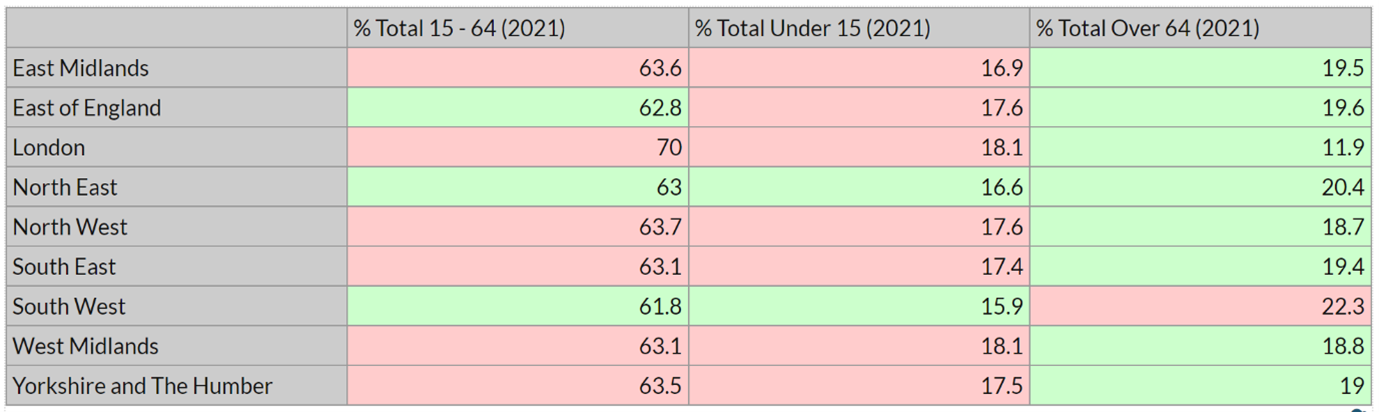
Table cell colour rules allow you to apply a background colour or text styles to table cells depending on the displayed data values.
We have changed the syntax of how these rules are defined (the old syntax still works) so instead of using 50|gt|#ff0000 to colour all cells red that have a value of greater than 50, the new syntax for this rule looks like this: greaterthan(50, #ff0000).
It is now possible to restrict a rule to a certain indicator by adding the indicator ID as an optional variable to the rule.
We have also added the ability to compare cell values to the value of a comparison feature of the same indicator. Equally you can compare cell values to the value of the currently selected feature.
Detailed information about the new syntax and expanded options can be found on this page: Table Cell Color Rules.
Bar charts with dates as series
With Report Builder 2.5.0 you can now create a chart like this:

You will need to have one single indicator with multiple dates selected and have the Series Type set to indicators-as-series.
Pyramid chart with comparison features: Data Label Left and Right now show in legend
When showing one or more comparison features in the pyramid chart, the legend previously only showed the feature names, and it was therefore not immediately clear what each side of the pyramid represented. We have now added the text from the Data Label Left/1st and Data Label Right/2nd settings into the legend so that the pyramid chart legend can look like the example below:

Light and Dark themes for the user interface
The Report Builder Editor can be viewed either in Light mode or Dark mode. This can be changed by clicking the User Settings in the top-right corner of the screen.

Updated icons
We have updated to a later version of the icon library we use in Report Builder. If your reports use icons in infographics or text widgets, these may now appear slightly differently. Here is an example:
| Old icon | New icon |
As some of the new icons will have different dimensions, you may wish to check any reports where you have either inserted individual icons or used one of our infographics widgets.
Updated styling
Existing users will notice that we have made some changes to the styling of the app but don’t worry, we have resisted the urge to move things around too much!

The home page now includes a footer bar with links to useful resources, for new users in particular.
Further enhancements
- Segment labels for Pie Charts can now contain both the indicator values (counts) and percentage figures
- Segment labels for Pie Charts can now contain the indicator names
- The default text for the bar chart setting X Axis Label Format has gained the variable #DATE. This means that new bar charts with time series immediately display multiple dates correctly.
Key bug fixes
- The Bar Label Width setting for Icon Charts has been fixed to use percentage values of the chart width. Prior to version 2.5.0 even very small values caused a much wider bar label width than what one would expect. If your existing reports contain icon charts, we highly recommend that you check these and amend this setting as necessary.
- Fix to certain links to the Report Builder help (e.g. from the home page and editor page).
- Map widget tooltips are now showing formatted numbers with thousand separators and decimal characters according to the locale of the report.
- Line charts using confidence intervals now work even if the first value doesn’t have data for the upper limit and lower limit source.
- The map snapshot button no longer overlaps with the CSV download icon once Thematic Mapping and Allow Table View are active
- If a chart shows value labels as badges, it no longer displays empty badges when the value is NULL.
- Tags added to a report via the Report Builder editor no longer gain spurious commas
We hope you will enjoy this new release of Report Builder!
If you have any questions relating to this release, please contact the Esri UK Technical Support helpdesk (UK and Ireland customers only). International customers please email internationalsupport@esriuk.com.