Overview
The main goal of this update is to align the user interface/experience of Report Builder more closely with other core apps within the ArcGIS system. These changes extend throughout the application, from the landing page right through to the most buried options. These changes have obvious benefits for users that are already familiar with the look and feel of Esri apps. But they also benefit other users too, as many of the changes are generic improvements to the clarity and use of the interface. Making these changes has also provided us with the opportunity to review and refactor code right the way through the application.
User interface key changes
Below are just some of the key ways in which the user interface has changed.
Landing page
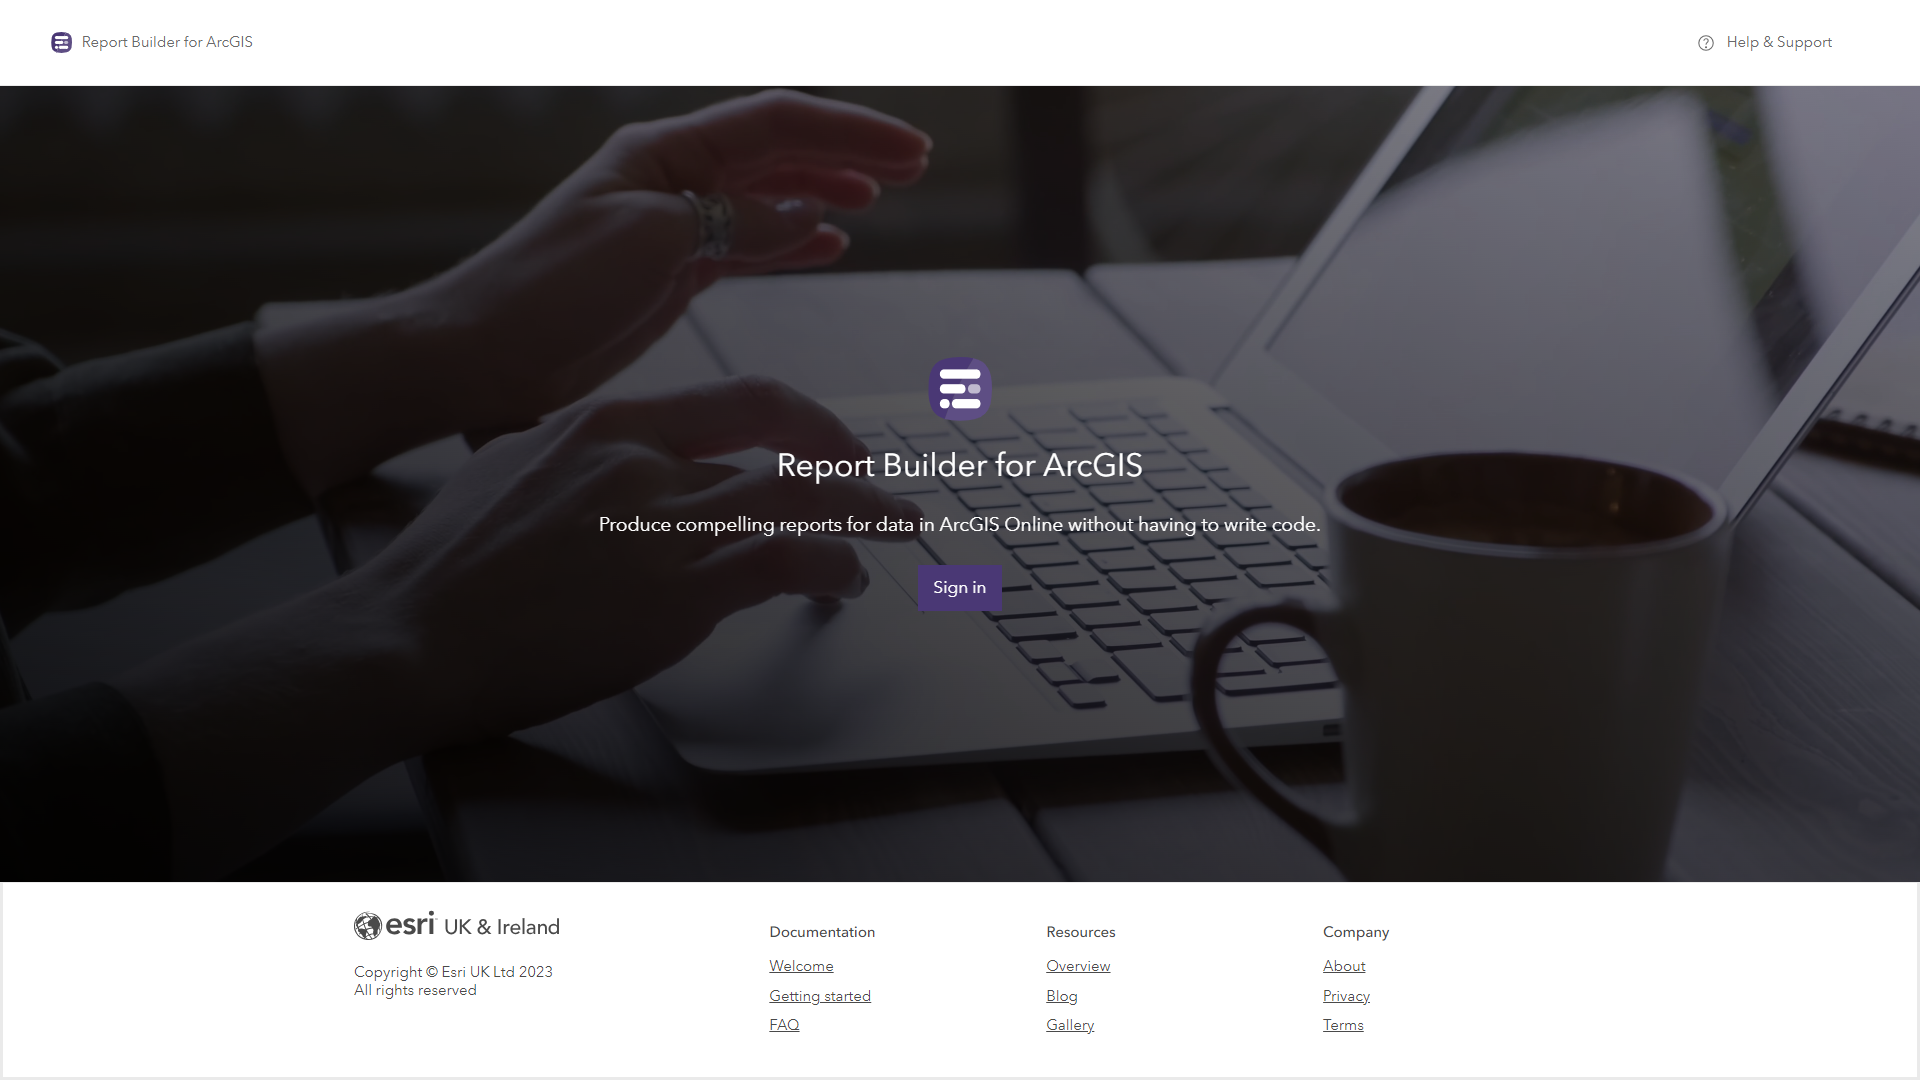
Existing users may spot that the landing page has been updated, we hope you like it!
Home page
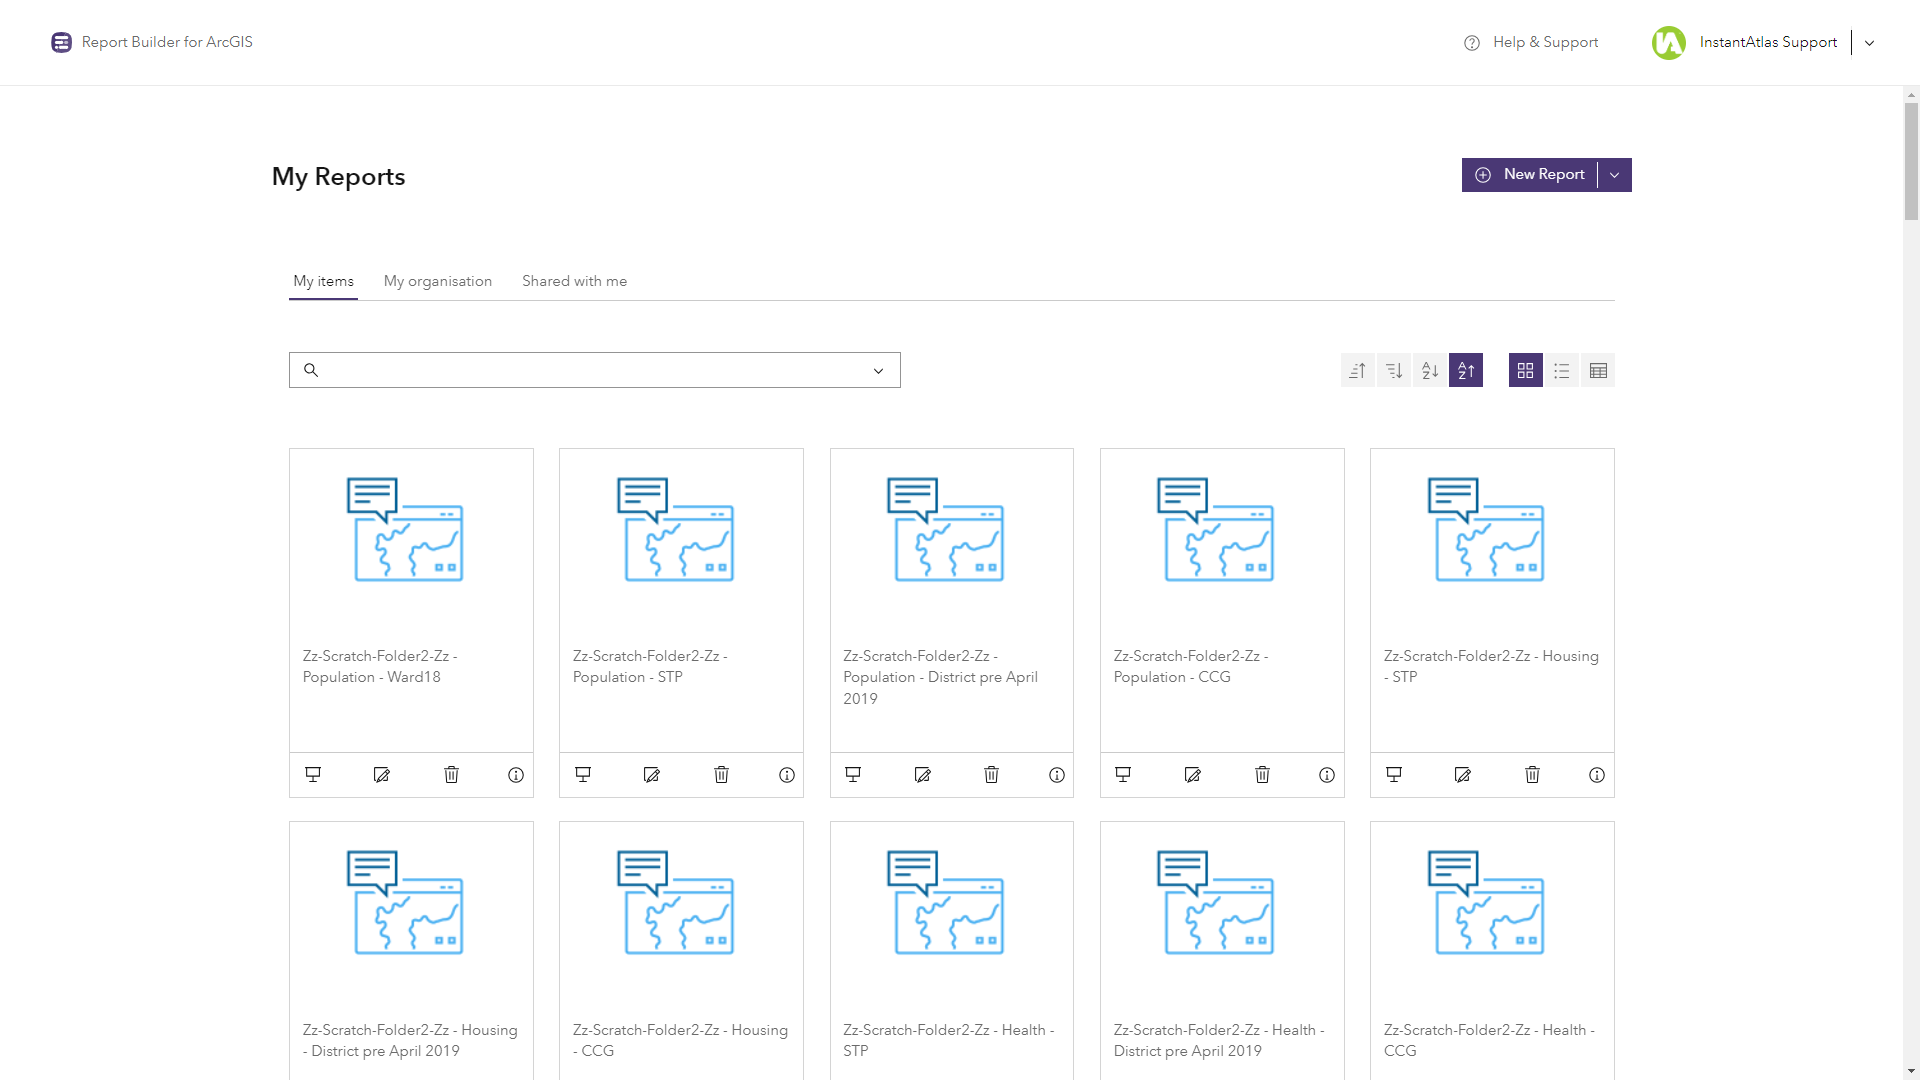
The Report Builder home page now displays a list of reports up front. There are options at the top of the page to view reports you own, reports owned by other users in your organization or reports shared with groups you belong to. There are handy buttons for sorting the list and changing the view. There is also a search box to search for a particular report by name and/or filter to reports saved in a particular folder or group. The information icon now opens a pop-up dialog showing some of the most commonly used item properties, such as the owner of the report and the ArcGIS Online folder it is saved in.
Menus
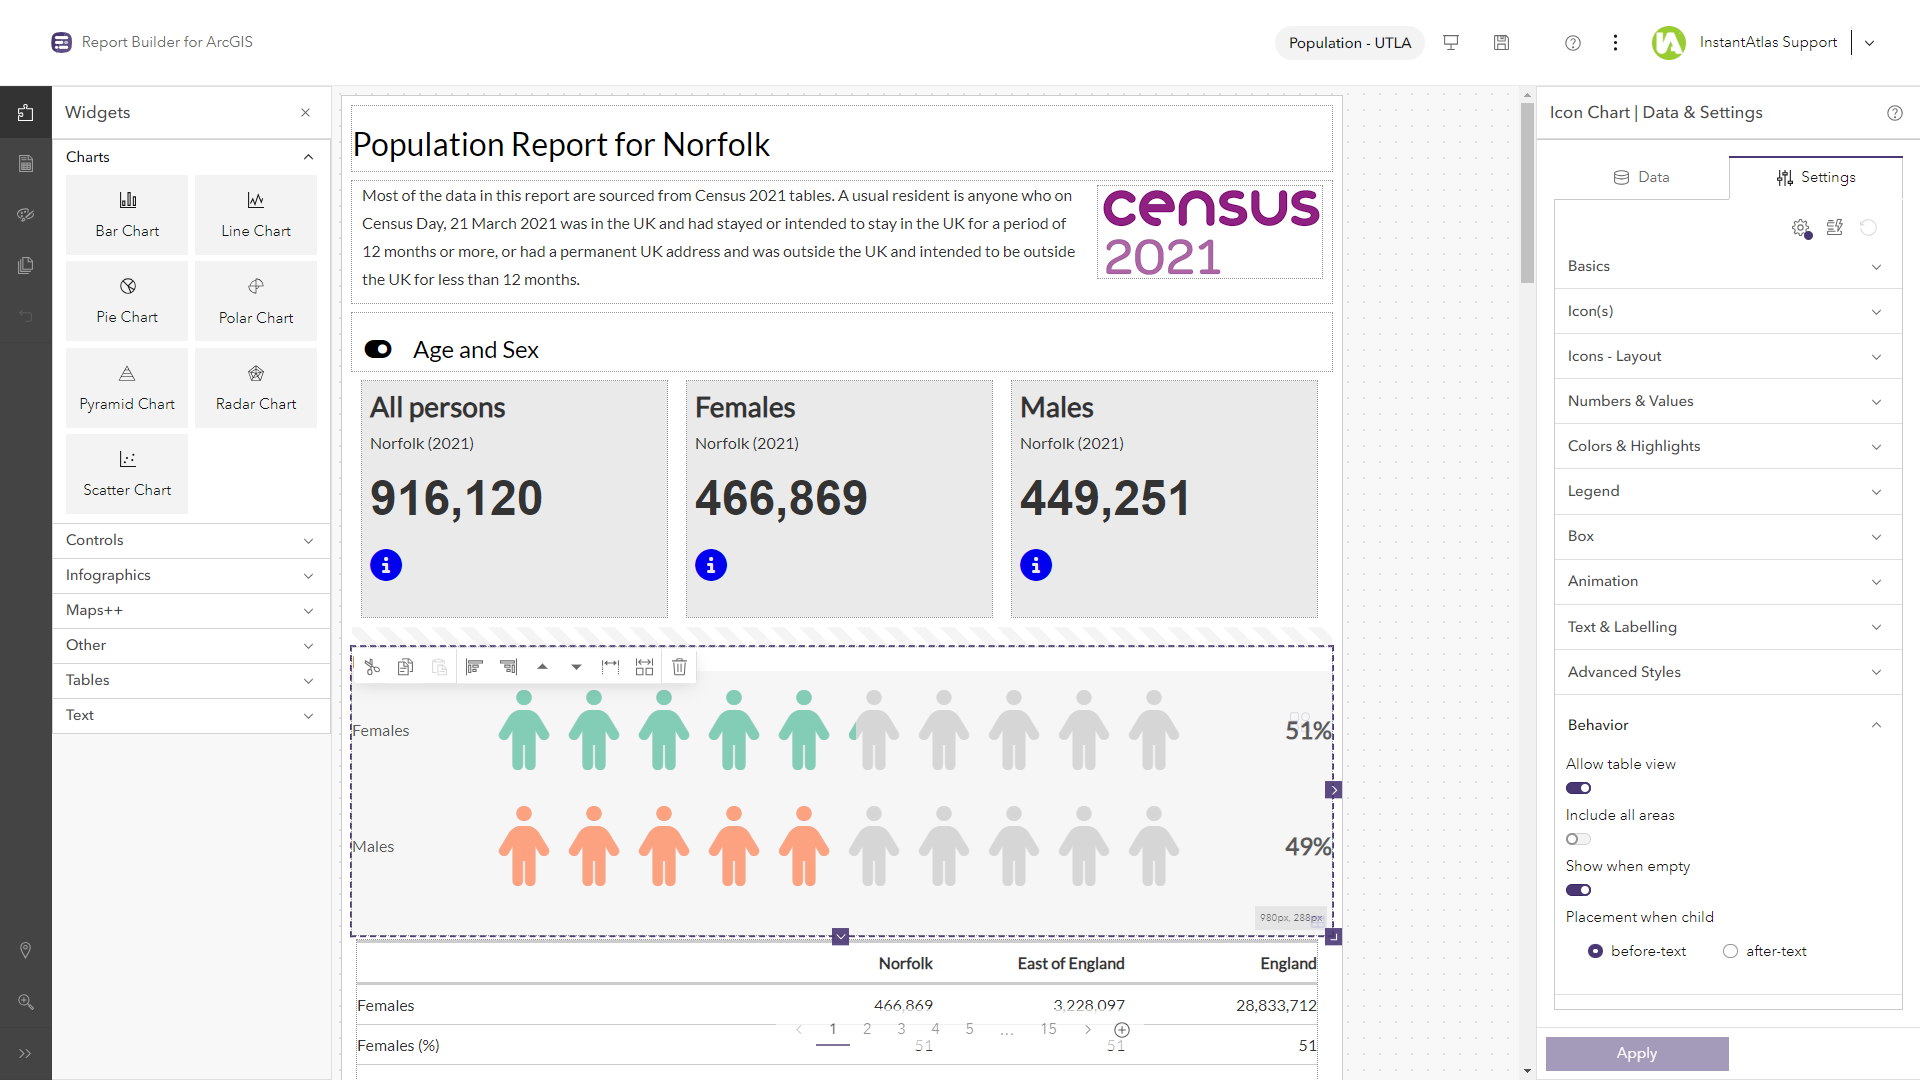
We have moved options into menus and reduced the popping open of modal windows as much as possible. The main menu for the Report Builder editor page is now located on the far left, as is the case in other core ArcGIS apps. By default this displays the options as icons in order to save space, but the menu can be expanded by clicking the >> button. The main options available from this menu open in a submenu just to the right. The width of this menu can also be adjusted by the user to give more room to the content. The widgets menu has been modernized and now displays widgets in a two-column layout.
Data & Settings panel
The Data & Settings panel is now permanently docked to the right hand side of the editor page. The display of the settings themselves has been modernized and setting group are collapsed by default, reducing the amount of scrolling required to get to a particular setting. Advanced settings can be toggled using the cogwheel icon at the top of the Settings tab. The width of the panel can now be adjusted, which is important if you have long indicator names in the Data tab.
Editor top panel
The editor top panel is less cluttered than before and only contains a small number of key elements: the Save, Preview and Help buttons, the Ellipsis for access to the editor preferences and the user information. The Save button gains a dot when it is active to show that there are unsaved changes in the report. You can access the light/dark mode toggle by clicking the arrow to the right of the user information.
Other key changes
Feature ID and name fields
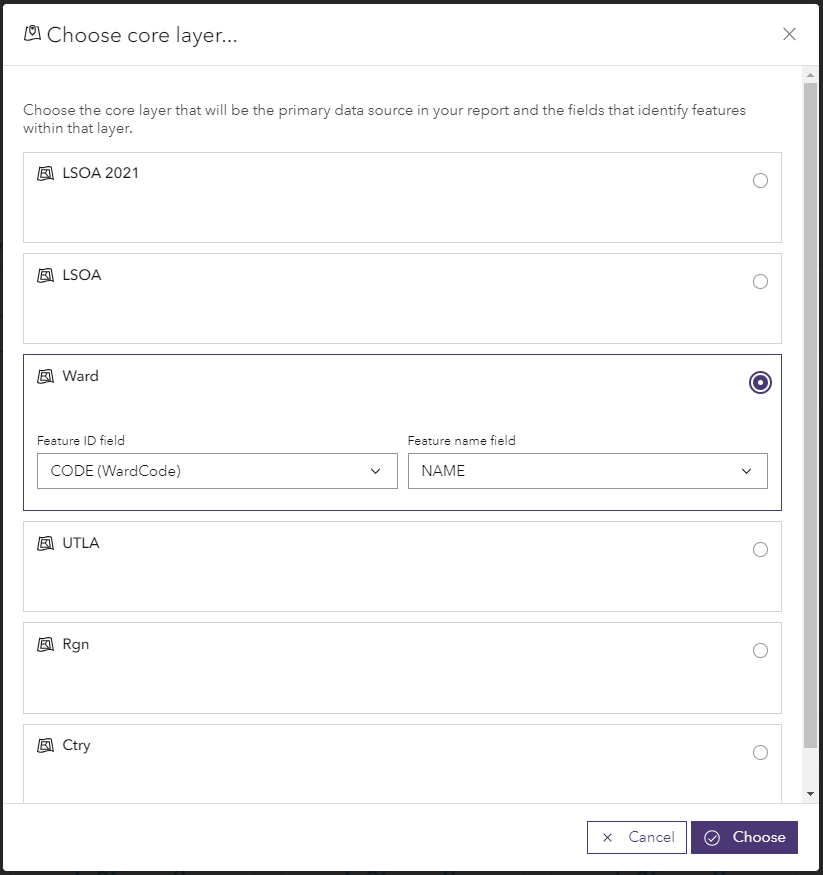
When you create a new report, you will be forced to select the core (or base) layer and the attribute fields that contain the feature IDs and names. This ensures that the correct feature IDs and names are being used right from the start. In previous versions of Report Builder it was possible to overlook this important step and this could cause problems at a later stage e.g. when trying to add further data sources to the report. Note that when creating a new report from an InstantAtlas data catalog, the ID and name fields will be automatically populated.
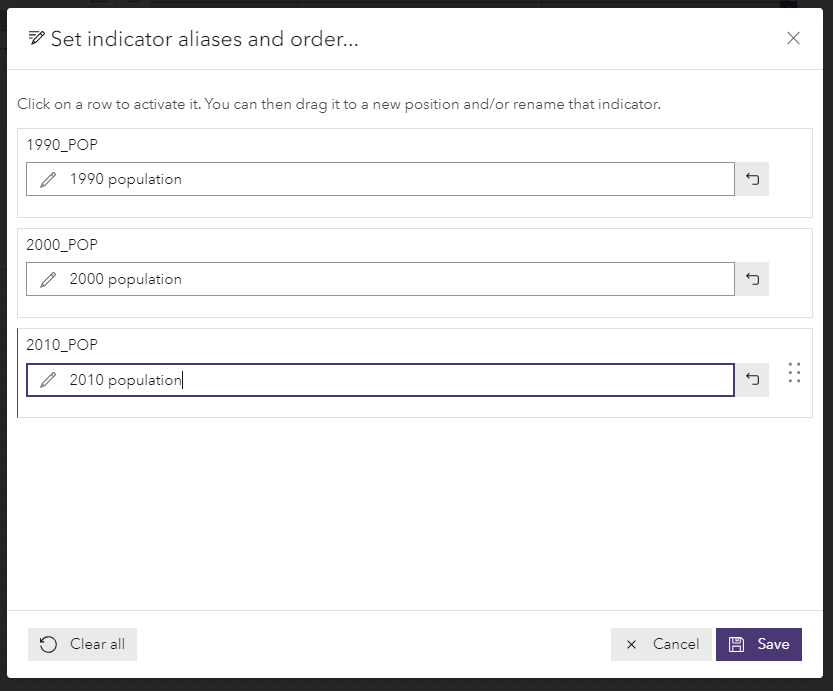
Indicator aliases and order
The window for setting indicator aliases and order has been upgraded. You no longer have to click on a button to edit each alias separately – these are always in edit mode. The text boxes also have more room to show content, reducing the need to scroll to see the full alias.
Text rules editor
The text rules window has been upgraded so that the rules are displayed to the left of the fallback text, which is a better visual representation of how this feature works. You can find more detail in the Text Rules page.
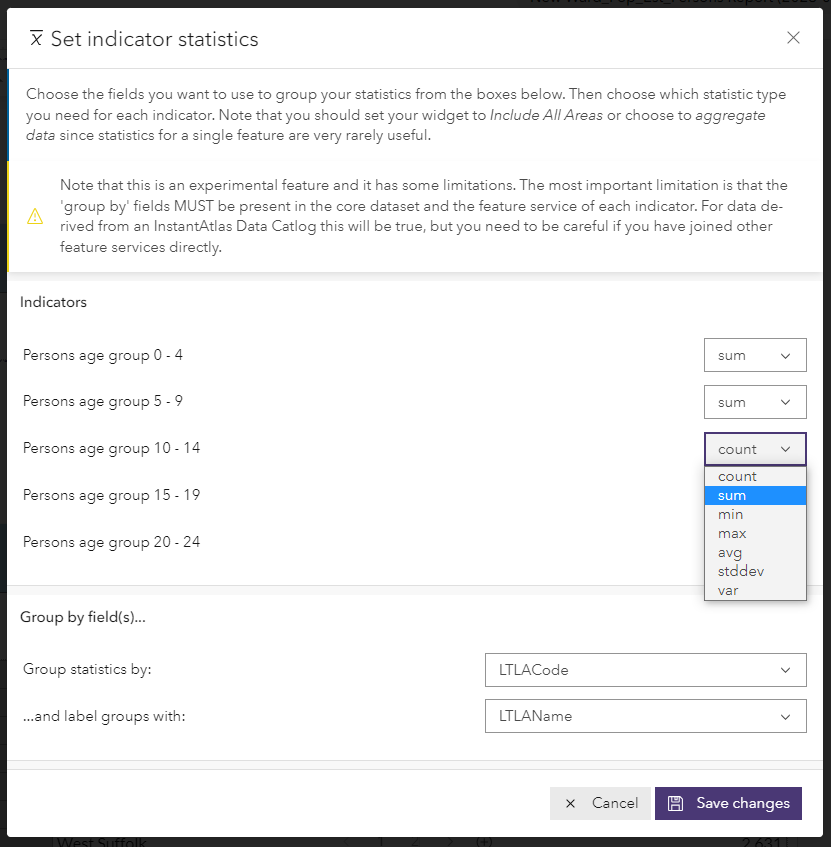
Indicator statistics
This advanced feature has been re-enabled and improved. It is accessed using the Indicator statistics button at the top of the Data tab. It enables the author to modify the display of a widget that would show data for multiple features, by generating statistics for groups of features. You can find more detail in the Indicator Statistics page.
Thumbnails
You now have the option to disable thumbnail creation when the Save button is clicked. This speeds up the save action significantly. You access this option using the Ellipsis in the Report Builder editor top panel.
Expanded view
You can now enable expansion, which means that reports can expand to fill the screen width at larger screen sizes. In this view, widgets will preserve their layout but expand their size. You access this option using the Styling > Views menu.
Base layer rendering in the Web Map widget
The Web Map widget will now render features in the report base layer using the rending defined at the item level in ArcGIS Online. Previously, it would only render features using the layer default renderer. You can change the item rendering in ArcGIS Online by browsing to the item, clicking Visualization and editing the layer rendering. More detail is available on our Web Map Widget page.
Google Fonts and GDPR
Report Builder can use Google Fonts in reports. To ensure that reports comply with General Data Protection Regulation (GDPR) these fonts are now hosted on the same service/URL rather than using the Google content delivery network (CDN) directly. More detail on the issues around Google Fonts, GDPR and IP addresses is available here. Note that this applies to fonts listed directly in the Report Builder editor – if you type the name of a Google-hosted font not in this list it will still come directly from the Google CDN, so you need to be careful if you are subject to GDPR.
Pyramid charts
The table view and CSV export now show data for each side of the chart (usually male and female) in separate rows, displaying the data labels as well as the area name.
Images
You can now add an image to a report simply by dragging it onto the page. An Image widget will automatically be created and the image file will be uploaded to your ArcGIS Online organisation.
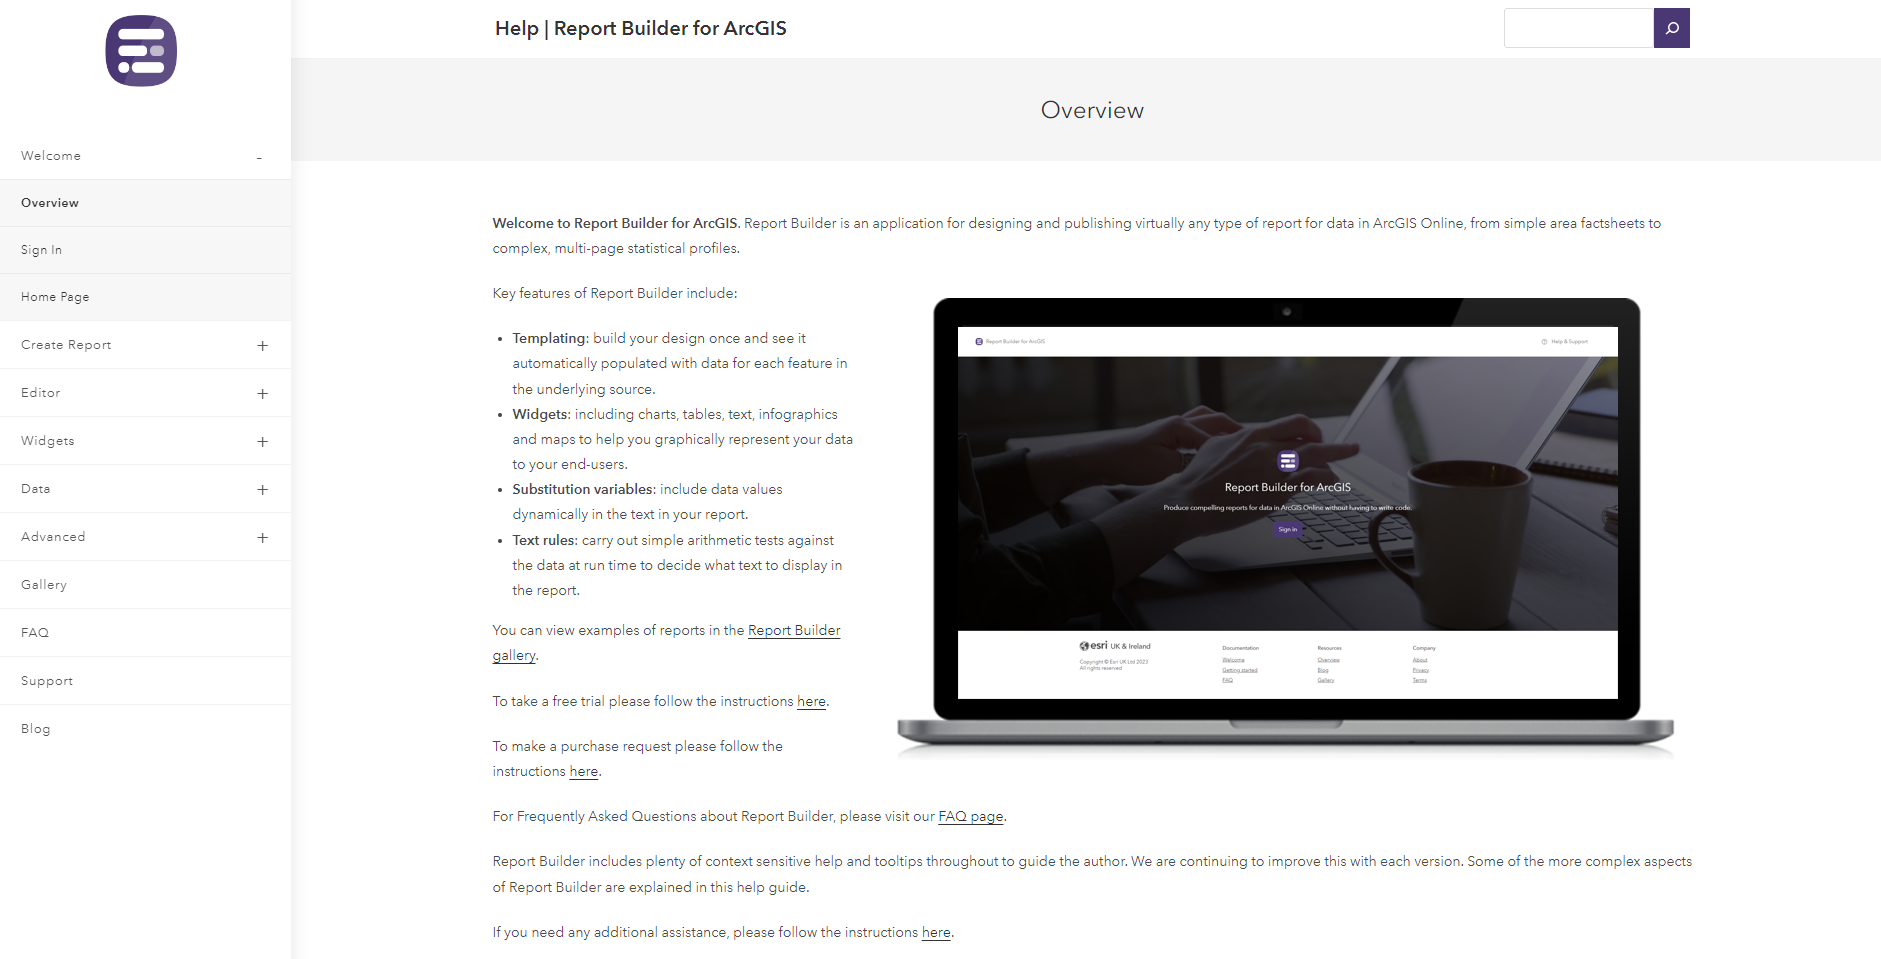
Help pages
The help pages for Report Builder have also been updated, expanded and restyled.
Key bug fixes
Below is the list of bugs that were fixed that will be of most interest to users. We also fixed other more minor bugs that are not listed.
- Visual issues in Report Builder when reducing the size of the browser window
- Deleted report would occasionally still show on the homepage
- Icon charts – indicator names not showing in table view
- Web Map Legend leaves a gap on the right of the widget when wrapping long lines
- Widgets within a text box widget cannot be reliably deleted
- Loading errors if feature ID strings only contain numbers
- Text rules – is [null] operator not working
Support
If you have any questions relating to this update, please contact the Esri UK Technical Support helpdesk (UK and Ireland customers only). International customers please email internationalsupport@esriuk.com.
We hope you will enjoy this update to Report Builder!