Overview
Report Builder version 2.7.0 comes packed with lots of enhancements such as search tools for widgets and settings, a new pyramid chart layout and the ability to style badge labels in charts, to just name a few. We have also use this opportunity to fix some bugs reported by customers.
Key enhancements
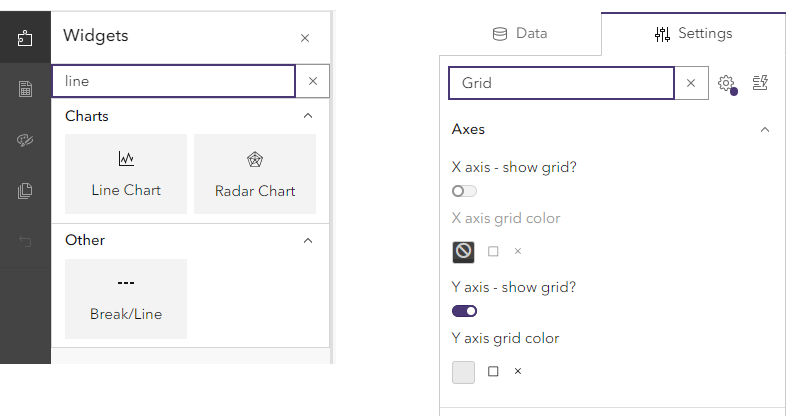
Search tools for widgets and widget settings
If you are unsure where to find a certain widget or setting, you can now use the new search tools to find these elements quicker. Please note that the widget search works with a set of keywords for each widget behind the scenes while the settings search only searches for the setting names.
New pyramid chart layout
We are introducing a new Standard layout for pyramid charts where the main difference is that the age group labels now appear on an axis to the left of the bars. This solved some issues with the previous layout to do with axis scaling and legend display. The previous layout is still available as Classic and any existing charts will keep the classic layout until the report owner decides to change it. Any newly added pyramid charts are using the new standard layout by default.
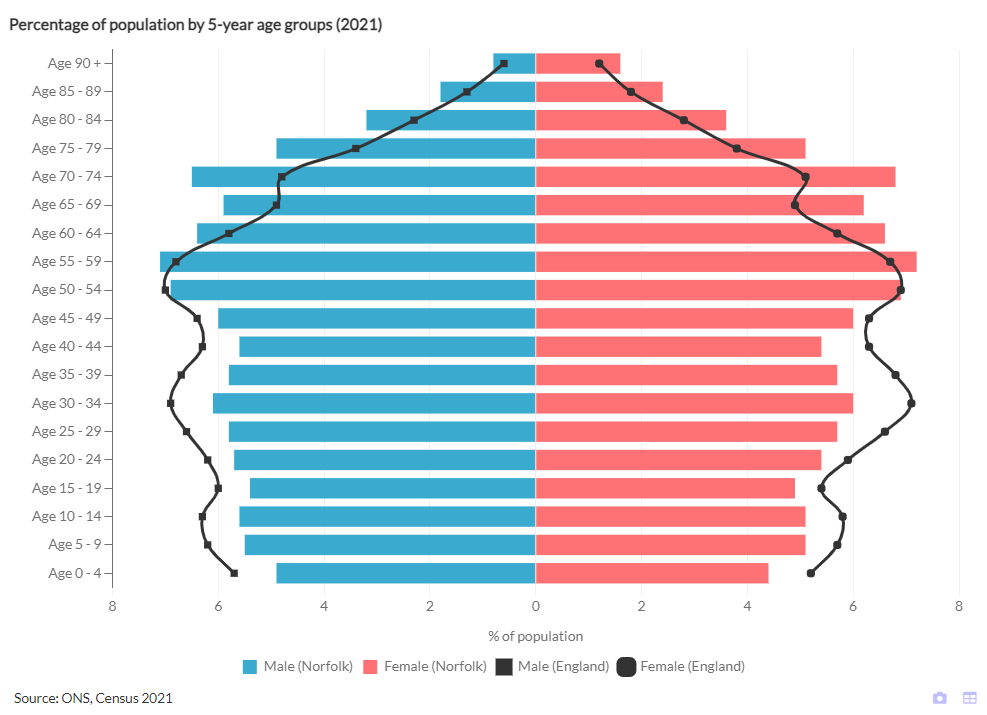
The standard layout allows you to add a second age group axis on the right-hand side to ease readability.
We have swapped the setting labels for X axis and Y axis settings around as referring to the – by default – horizontal axis as X and the vertical axis as Y is more common.
Ability to style badge labels in charts
Badge-style data labels can now be configured to have a different background colour than the bar or line they refer to. You can also adjust the badge border colour, border width and border radius to configure the appearance.
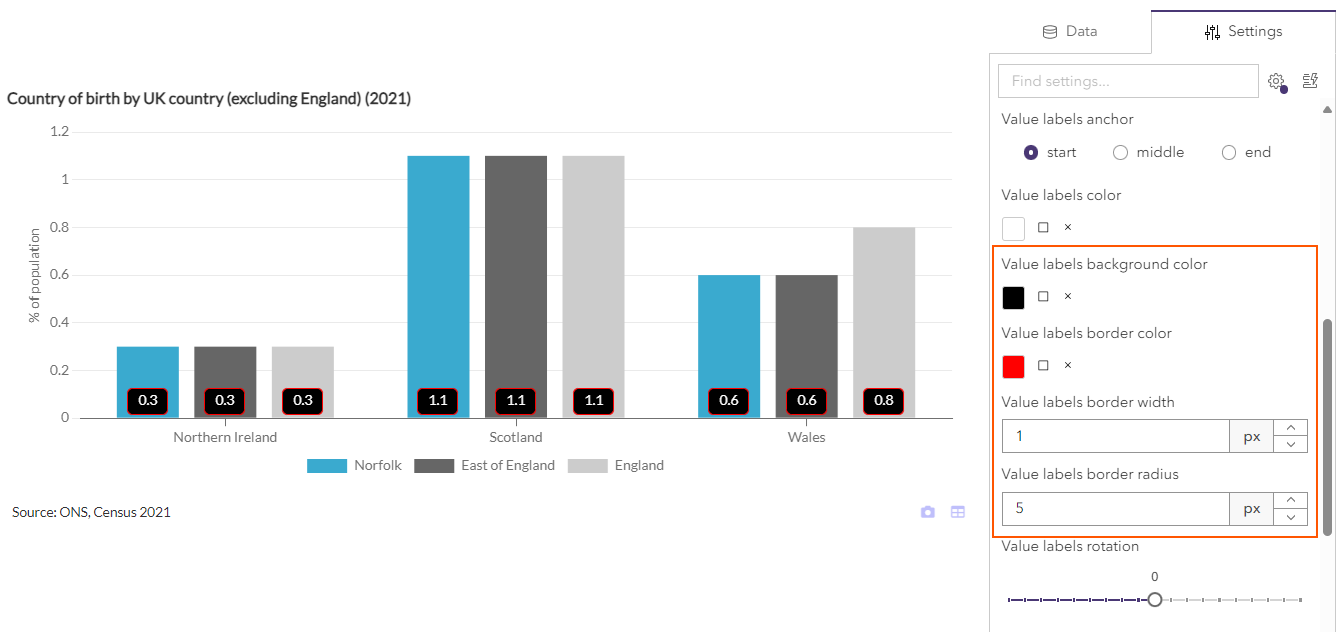
To make it easier to find them, the data labels settings have been re-organised into their own settings group called Data Labels.
Enhancements to how text widget changes are saved
In the past users may have lost changes to text widgets by unintentionally clicking outside the text editor frame. We have now added a dialog that will ask if you wish to save your changes when clicking outside the editor.
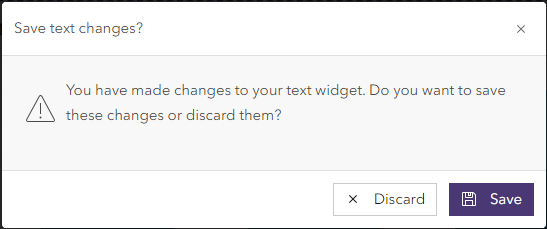
If you wish for text changes to be saved automatically when clicking outside the editor, you can switch this option on in the report builder settings.

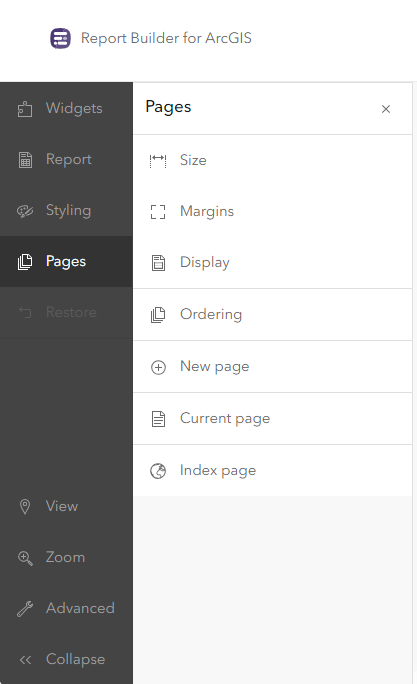
Re-organised Pages menu
Settings that used to be located under Pages – Advanced have now been moved to more logical parts of the menu. Pages – Display now contains settings for page borders and navigation while Pages – Index page contains settings controlling the layout of the index page. A new Advanced menu item at the bottom left allows access to less frequently used settings related to data loading and interactivity.
Further enhancements
- The Maps++ widget group has been renamed to Spatial.
- The Shared with me tab has been renamed to My groups.
- We have updated some dependencies and libraries we use in the background which means that some dialogs might look slightly differently than before.
- On smaller screen widths table widgets will now show a light border between table columns which also forces some space between cells to improve readability
- We have relaxed the acceptable list of characters in feature IDs. This now allows feature IDs to contain dots or spaces.
- A new Indicator Metadata widget allows metadata to be displayed if the report is using a data catalog as the data source. This can be shown in list view, table view or only the value of the selected metadata item(s).
- Improvements to the Layer Attachments widget allow a filtering of multiple attachments on the same record by file name pattern, file type or index. Multiple attachments can be displayed using different layout options.
- Improved feature sorting in tables and charts when using comparison features from lookdown relationships.
- Improved chart widget font settings for axis and legends to inherit the font family from the whole report unless specified differently in a widget.
- For chart axis and legends it is now possible to pick a suitable font family from a list of suggestions.
Key bug fixes
- Pie Charts now work correctly even if the selected indicators originate from different data sources e.g. two different CSV files.
- The Icon Chart no longer clips the top-most tooltip.
- Image widgets display the image correctly if both the image and the report are shared with the ArcGIS Online organisation (not public).
- Improved x axis scaling for population pyramids in standard mode.