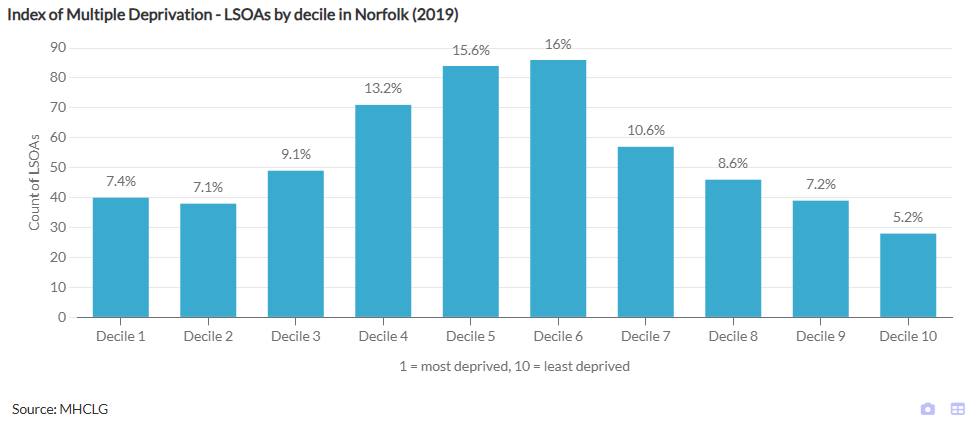
Within the National Data Service (NDS), the Index of Multiple Deprivation (IMD) dataset is only available for the LSOA 2011 geography layer. For reports based on other standard geographies, such as Local Authorities or Wards, our standard reports contain especially configured bar charts that show a distribution of LSOA across the IMD deciles:
The below steps will explain how to create such a chart from scratch either using the IMD data from the NDS or a similar dataset.
Please note: A quicker and easier way to recreate such a chart might be by opening one of our standard reports in the Report Builder Editor e.g. by using this link, then taking a copy of the chart widget and pasting it into your own report. Depending on the layer your report is based on, you may need to tick the comparison relationship to the LSOA layer in the widget properties.
Follow these steps to create the above bar chart from scratch:
- Add a Bar Chart to your report, remove all pre-selected indicators and choose an IMD Decile indicator.
- In the widget properties, in the Basics group, switch on the Show comparison features setting and select the “look down” comparison relationship that points to the LSOA layer (within the NDS this will start with LSOA ← followed by the name of the geography layer the report is based on, e.g. LSOA ← UTLA).
- In the Series settings group, select indicators-as-series for the Type.
- Also in the Series settings group, turn Use counts per value on.
- Ensure the Advanced settings are visible and find the setting Restrict count values to. Add the value
1,2,3,4,5,6,7,8,9,10into the text field. This step is optional, but the ordering of the bars might not be ideal if you skip this.
The result of the above will look like this:

This can now be further modified to remove the legend, adjust the colour palette, add a chart title, axes titles, bar data labels and grid lines. To add the text ‘Decile’ to the X axis labels, find the setting X axis label format in the Axes setting group and enter Decile #NAME.