Overview
Report Builder version 2.7.1 includes a few enhancements to the Set indicator aliases and order dialog as well as a new Colour Picker pop-up. We have also addressed a number of bugs with issues reported by our customers or internal users.
Key enhancements
Quick edit tools in the Set indicator aliases and order dialog
The Set indicator aliases and order dialog, which can be accessed via the Data tab in each widget’s Data & Settings panel, has gained some useful tools to speed up editing of the indicator aliases and ordering. You can select multiple indicators and move them up or down the list of indicators in a block. It is possible to revert back to the original indicator names using the Clear aliases button either for all indicators when none are selected or only for the selected subset. The new Find & replace option allows for a quick replacing of the same text in the aliases, again either for all indicators when none are selected or only for the selected subset. These tools are especially useful when working with population pyramids e.g. if you wish to swap out the sides of males and female data or shorten the aliases to only show the age groups.

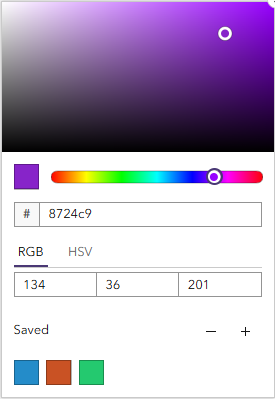
New colour picker pop-up
We are introducing a new colour picker pop-up which allows colour values to be saved and then reused across other widgets and reports. It is now also possible to paste hexadecimal values directly into the pop-up which wasn’t possible with the old colour picker.
Key bug fixes
- RB-7636: The title of Table widgets now spans the whole table width when columns are grouped.
- RB-75033: The Population Pyramid chart again shows comparison lines at the correct location when using multiple comparison geographies.
- RB-76007: Changes to the ‘When’ statement of Text Rules in Text widgets are again applied correctly.
- RB-76971: When using multiple feature selections (such as through the Custom Area Report), reports with Bar Charts set to show both aggregated and disaggregated data now do indeed show both variants.
- RB-76972: When using multiple feature selections (such as through the Custom Area Report) and showing both aggregated and disaggregated data, the aggregated values (‘Selected Areas’) now always show in front of any disaggregated data or comparison features and no longer display in alphabetical order within the disaggregated features.
- RB-77634: It is again possible to replicate our Index of Multiple Deprivation (IMD) bar charts. These charts use a lookdown relationship to count the number of features within a certain IMD decile. An important setting called Restrict count values to has again been exposed in the widget settings interface, allowing for these kind of bar charts to be created from scratch.
- RB-75226: It is now possible to paste a hexadecimal colour code into the new Colour Picker (see Enhancements above).